MVF v1: Render with Leaflet
As an extension of GeoJSON, the Mappedin Venue Format (MVF) is easy to integrate with various GIS tools and technologies. We use Typescript in this guide to help us with the GeoJSON data structure but the code works with small modifications in Javascript as well.
In this guide, we will render the Mappedin Demo Mall using a popular web map library, Leaflet.
Setup
- Start a new Vite Typescript -project (or JS tooling of your choice) with
yarn create vite mappedin-leaflet- Select Vanilla and Vanilla-ts
- Then run
cd mappedin-leaflet && yarn yarn devto start run the project. This will display a Vite welcome page
- Download the MVF sample package
- Extract the contents of
Demo Mall MVFfolder to todata/mappedin-demo-mall/in the project folder - Add Leaflet with
yarn add leaflet - Install Leaflet and GeoJSON types as DevDependencies
yarn add -D @types/leaflet @types/geojson
Modify your index.html to the following
<!DOCTYPE html>
<html lang="en">
	<head>
		<meta charset="UTF-8" />
		<meta name="viewport" content="width=device-width, initial-scale=1.0" />
		<title>Leaflet MVF</title>
		<link
			rel="stylesheet"
			href="https://unpkg.com/leaflet@1.7.1/dist/leaflet.css"
			integrity="sha512-xodZBNTC5n17Xt2atTPuE1HxjVMSvLVW9ocqUKLsCC5CXdbqCmblAshOMAS6/keqq/sMZMZ19scR4PsZChSR7A=="
			crossorigin=""
		/>
		<style>
			body,
			html {
				margin: 0;
				padding: 0;
			}
			#map {
				height: 100vh;
			}
		</style>
	</head>
	<body>
		<div id="map"></div>
		<script type="module" src="/src/main.ts"></script>
	</body>
</html>
Clear src/main.ts and add the following imports and styles. For spaces, we use a StyleFunction that returns PathOptions based on the GeoJSON feature's properties.
import * as L from 'leaflet';
import * as GeoJSON from 'geojson';

const styles = {
	building: {
		color: '#BF4320',
		opacity: 0.5,
		fillOpacity: 1,
		fillColor: '#fafafa',
		dashArray: '5 10',
	},
	level: {
		fillColor: '#777',
		fillOpacity: 1,
		color: 'black',
		weight: 1,
	},
	spaces: (feature: any) => {
		return {
			color: 'black',
			weight: 1,
			opacity: 1,
			fillOpacity: 1,
			fillColor: feature.properties!.color || 'white',
		};
	},
	obstruction: {
		weight: 0,
		fillColor: 'black',
		fillOpacity: 1,
	},
	node: {
		radius: 2,
		fillColor: '#BF4320',
		color: '#000',
		weight: 1,
		opacity: 1,
		fillOpacity: 0.4,
	},
};
Loading MVF data
We will load the data using fetch. Manifest.geojson-file in the MVF folder explains the structure and other files in the bundle. Data model documentation explains the files and their properties in detail.
async function loadData(filename: string) {
	return (await fetch(`${filename}`)).json();
}
Mappedin Demo Mall features 3 levels and most of the data is divided into 3 files named after the level id. For this quick guide, we will hardcode our level id. . We can find the level id of "Lower Level" by looking at the properties of the level -files and selecting the correct file name.
const levelId = '5835ab589321170c11000000';

const building = (await loadData('data/mappedin-demo-mall/building.geojson')) as GeoJSON.FeatureCollection;

const level = (await loadData(`data/mappedin-demo-mall/level/${levelId}.geojson`)) as GeoJSON.FeatureCollection;

const space = (await loadData(`data/mappedin-demo-mall/space/${levelId}.geojson`)) as GeoJSON.FeatureCollection;

const obstruction = (await loadData(
	`data/mappedin-demo-mall/obstruction/${levelId}.geojson`,
)) as GeoJSON.FeatureCollection;
Creating and drawing layers
We create the building layer first so that we can use it to define the area where Leaflet displays the map. getBounds() calculates the boundaries needed to display the whole area described by the building polygon data. The map is drawn to the element with id map.
const buildingLayer = L.geoJSON(building, {
	style: styles.building,
});

const map = L.map('map', {
	maxBounds: buildingLayer.getBounds(),
});

map.fitBounds(buildingLayer.getBounds());
With the spaces, we filter the data to make sure that we only draw polygons, because it also includes Point geometry.
const levelLayer = L.geoJSON(level, { style: styles.level });
const obstructionLayer = L.geoJSON(obstruction, { style: styles.obstruction });

const spaceLayer = L.geoJSON(space, {
	style: styles.spaces,
	filter: (feature) => {
		return feature.geometry.type === 'Polygon';
	},
});
Add layers to the map in the order in which they are drawn
buildingLayer.addTo(map);
levelLayer.addTo(map);
obstructionLayer.addTo(map);
spaceLayer.addTo(map);
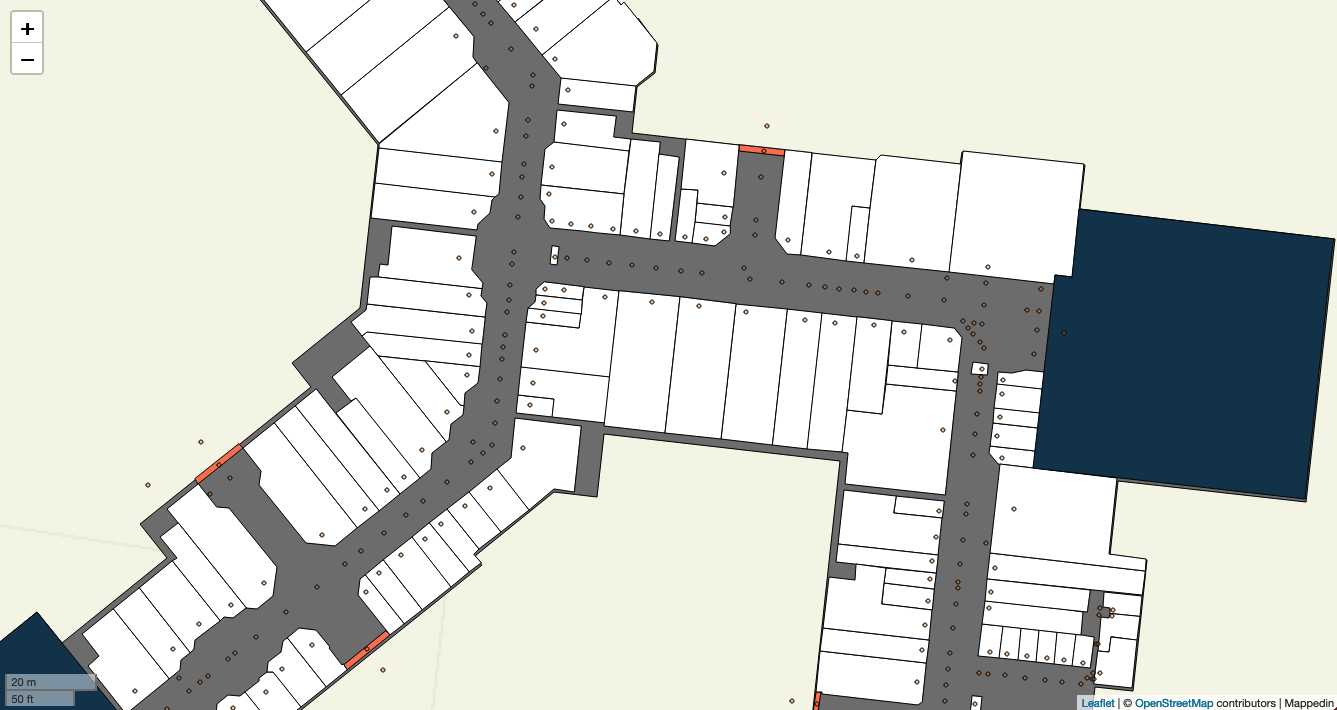
This is how the map looks at the end. The orange dots represent nodes, which can be used for pathfinding through the venue. The MVF package comes with rich data about each location in the venue and all of that can be added on top of the base built in this tutorial.